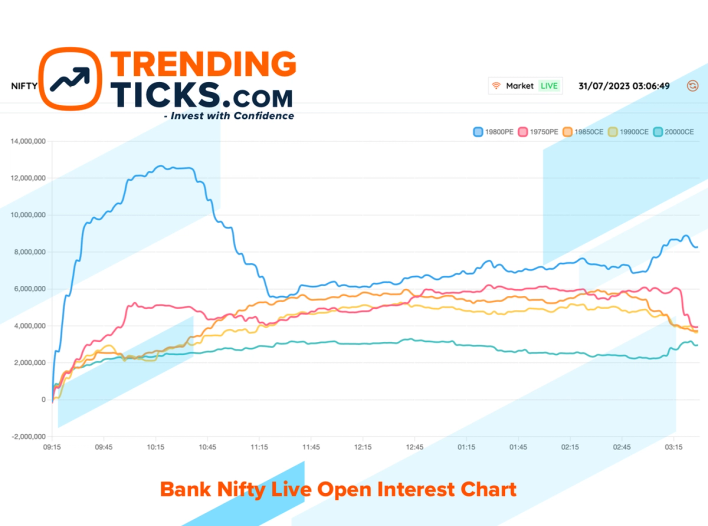
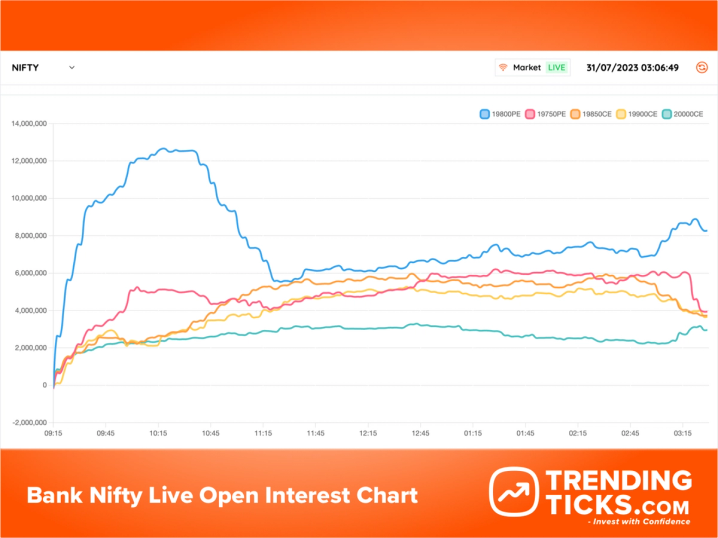
Bank Nifty Live Open Interest Chart
Using Bank Nifty Live Open
Interest (OI) charts can be
a part of a comprehensive
trading strategy. Open Interest represents
the total number of outstanding
futures or options contracts that
are not yet closed or
delivered. It reflects the overall
market interest in a particular
asset.

CTO at TrendingTicks
Using the Bank Nifty Live Open Interest (OI) Chart can be a valuable tool for traders seeking to make informed decisions and enhance their chances of successful trades. Open Interest refers to the total number of outstanding derivative contracts, such as futures and options, for a particular asset. Analyzing the Bank Nifty Live Open Interest Chart can provide insights into market sentiment, and potential price movements, and help traders identify optimal entry and exit points. Here's a descriptive guide on how to utilize this information for more successful trading:
Understanding Open Interest
Rising OI with Rising Prices (Long Buildup)
If Bank Nifty prices are rising along with an increase in open interest, it suggests that new money is flowing into the market, indicating a bullish trend. Traders might consider long positions in anticipation of further price increases.
Falling OI with Falling Prices (Short Buildup)
Conversely, if Bank Nifty prices are falling while open interest is decreasing, it indicates a bearish sentiment. Traders may consider short positions in anticipation of further declines.
Check out our Bank Nifty Live Open Interest Chart
OI and Price Trends
High OI with Price Increase (Long Unwinding)
When open interest is high, but prices are rising slowly or stabilizing, it might indicate that existing long positions are being unwound. Traders should be cautious, as this could signal a potential reversal or consolidation.
High OI with Price Decrease (Short Covering)
If prices are falling while open interest remains high, it suggests that short positions are being covered. This scenario may indicate a potential bullish reversal.
OI and Support/Resistance Levels
OI Concentration at Support/Resistance
Identifying high open interest levels at key support or resistance levels can provide additional confirmation for potential price reversals or breakouts. Traders may use this information to adjust their strategies accordingly.
OI Changes Before Events
Ahead of Events or News
Monitoring changes in open interest before significant economic releases, corporate announcements, or other market-moving events can provide insights into how institutional investors are positioning themselves. Traders might adjust their positions based on these anticipations.
Volume and OI Divergence
Divergence Analysis
Analyzing the relationship between trading volume and open interest can offer valuable clues. For example, if prices are rising on increasing volume but open interest is declining, it could suggest that the current trend may be losing momentum.
Options Data Integration
Combine with Options Data
Integrating information from options data, such as implied volatility and option Greeks, with the Bank Nifty Live Open Interest Chart can provide a more comprehensive view. This can aid in constructing more sophisticated trading strategies.
Real-time Monitoring
Stay Updated
Given the dynamic nature of financial markets, real-time monitoring of Bank Nifty Live Open Interest is crucial. Traders should use platforms that provide up-to-the-minute data and tools for accurate analysis.
Risk Management:
Set Clear Stop-Loss and Take-Profit Levels
Regardless of the insights gained from the OI chart, it's crucial to implement effective risk management strategies. Set clear stop-loss levels to limit potential losses and take-profit levels to secure profits.
By integrating these strategies and insights gained from the Bank Nifty Live Open Interest Chart, traders can make more informed decisions, identify potential trends, and position themselves for successful trades while minimizing risks.